1. Summary
The traditional Merit Order model has long served as a valuable tool for visualizing electricity market dynamics at a given point in time. However, as storage systems scale and demand becomes more responsive to price signals, the model must evolve to remain insightful.
Incorporating energy storage and demand-side flexibility into the Merit Order increases its complexity—but also its realism. To reflect this, a time-coupled view of dispatch decisions is essential. Static snapshots are giving way to temporal analyses that better capture how supply, demand, and prices interact over time in a high-renewables power system.
2. Context and Background
Europe’s electricity markets are undergoing a profound transformation. The rapid buildout of renewable energy and the retirement of dispatchable fossil assets are driving increased price volatility. This has elevated the strategic value of flexibility—both from storage technologies and price-sensitive demand.
2.1. Market Volatility
The volatility of Day-Ahead (DA) market prices is already evident. Even with normalized gas prices and stable nuclear output in 2024, compared to the years of the “Energy Crisis” before, volatility remains high compared to historic norms. As more variable renewables enter the mix, this trend is expected to continue.
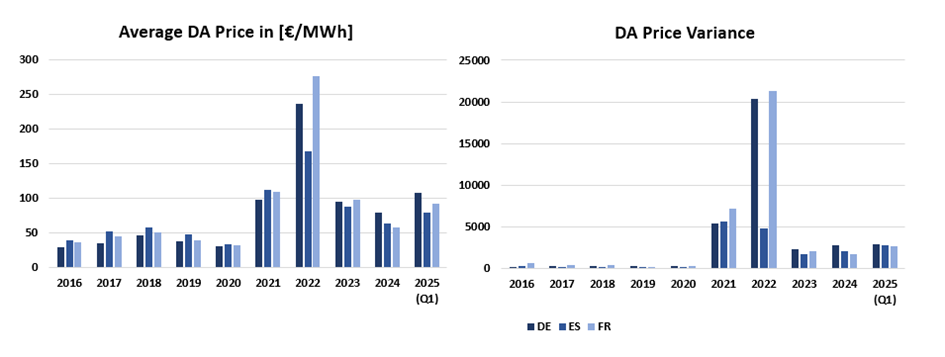
Graph: Yearly average DA prices and yearly variance in France (FR), Spain (ES) and Germany-Luxemburg (DE). For DE prices before October 2018 include the bidding zone Austria.
Source: Energy Charts URL: https://www.energy-charts.info/?l=en&c=DE
2.2. Battery Predictions
As batteries are currently the most scalable technology for short-term flexibility they will see a major uprise in capacity over the next years. It is of course difficult to predict the exact storage capacity that will be added in the next years, but almost all sources forecast high growth rates.
Aurora Energy Research predicts a fivefold increase to 51 GW operational battery capacity in the EU (incl. GB) by 2030, based mostly on projects in development. In terms of total storage capacity, Goldman Sachs estimates a sixfold increase from around 21 GW in 2024 to 119 GW in 2030.
2.3. Flexibilization of Demand
Less prominent but equally important is the flexibilization of demand. Industrial consumers already start adjusting consumption in response to price spikes. Moving forward, increased digitalization, real-time metering, and dynamic tariffs will enable broader demand-side response across sectors.
Organizations like ACER and Eurelectric have emphasized the need for active demand participation in a renewables-based system.
3. Updates to the classic Merit Order Model
3.1. Storage in the Supply Stack
Storage units behave differently from traditional generators. Their marginal cost of discharge is not a fixed fuel cost but a combination of:
Capital Costs (based on degradation per cycle)
Charging Costs (based on market price during charging)
Opportunity Costs (potential lost profits from discharging at a later, higher price)
Capital Costs would depend on the technology itself and the degradation of the battery per cycle.
Charging Costs is determined by the market price at the moment of charge.
Opportunity Costs can be identified as the price difference between one point in time and another with a higher market price. As a battery can only generate a limited amount of electric energy, this energy should be generated when the market price is the highest. Therefore batteries do not simply produce whenever there is a break-even point in total costs and revenue but only when revenues are expected to be the highest.
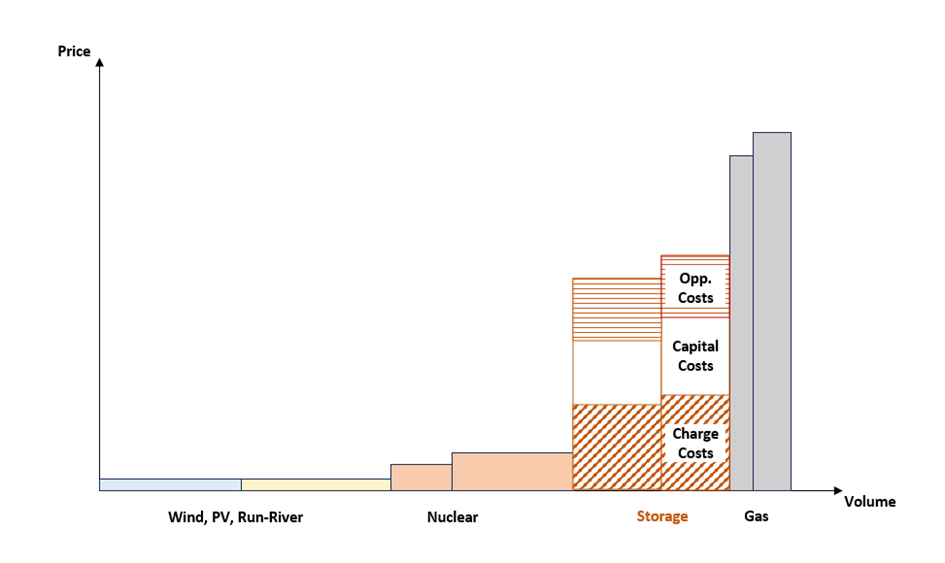
Graph: Merit Order with battery capacity in the supply curve.
3.2. Visualization of Demand Flexibility
The traditional Merit Order uses a fixed demand line. In a more dynamic future, this should be replaced with a downward-sloping demand curve, reflecting the volume of flexible consumption that can be curtailed or shifted at various price points.
Another variation integrates demand-side flexibility as pseudo-supply—stacked at higher price points, similar to how some operators today visualize demand-side response in balancing markets.
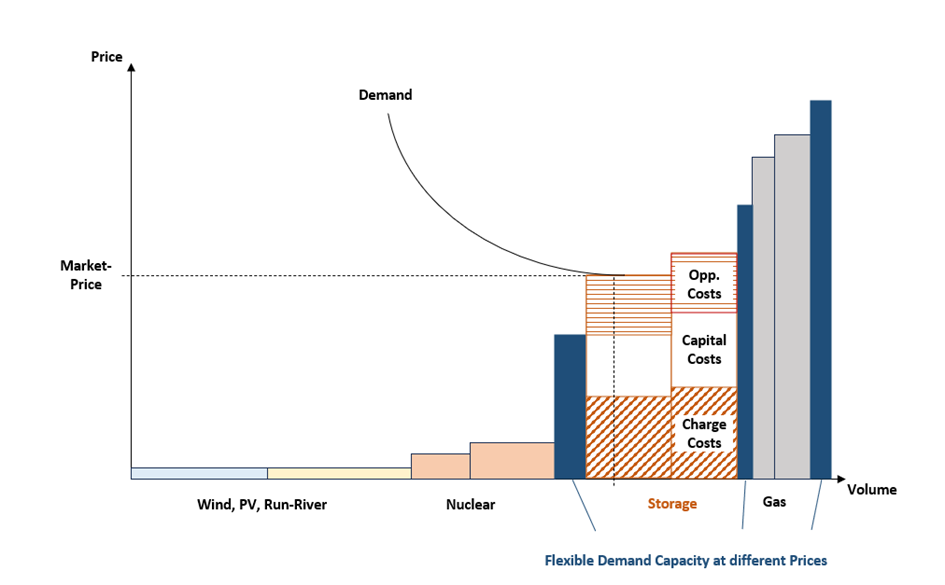
Graph: Merit Order with storage capacity and demand-side flexibility in the supply curve.
As such the Merit Order Modell will stay the same and the message will remain mostly the same. The pricing mechanism will still be clear to see with the generation unit with the highest marginal costs determining the market price. With dispatch decisions that increasingly depend on past and future conditions, static merit order snapshots however lose some explanatory power.
3.3. Including Line Charts for a more holistic View
As generation and demand are becoming more interlinked with periods before and after, it can be helpful to include line charts showing generation, demand and market price.
The graph below illustrates how time-based line charts can enrich the classic Merit Order model by showing the evolving dynamics of supply, demand, and price throughout the day.
The upper panel displays the electricity price, highlighting the volatility and temporal shifts in market conditions.
The middle panel breaks down volume by generation type, including renewables, gas, and batteries—revealing how each technology ramps up or down in response to changing conditions.
The three Merit Order snapshots below correspond to 04:00, 11:00, and 18:00, showing how the dispatch stack shifts across the day. At 11:00, abundant solar generation pushes down prices and enables battery charging, while in the evening peak (18:00), storage discharges to meet high demand. Battery generation capacity and their marginal costs vary though out the day. This visual approach helps capture the intertemporal nature of dispatch decisions, which the static Merit Order alone cannot convey.
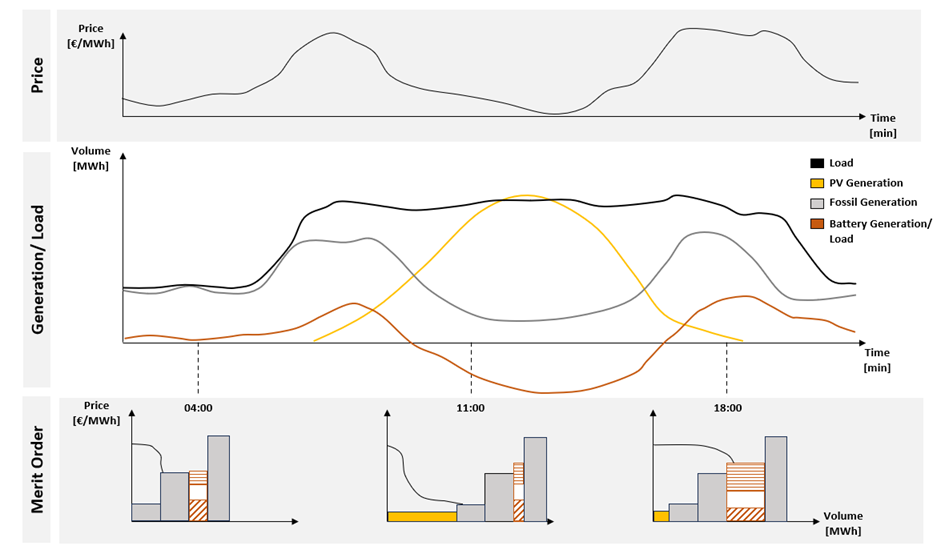
Graph: Depiction of how the Merit Order can be combined with line charts on a generic summer day.
4. Conclusion
The traditional Merit Order remains conceptually sound. However, the increased complexity introduced by storage and flexible demand makes the model less intuitive and less complete.
To maintain relevance, the Merit Order could evolve into a time-coupled framework, capable of capturing the interplay between flexibility, prices, and system constraints. This evolution also implies a growing need for advanced forecasting tools, smarter dispatch models, and more sophisticated visualization methods.
As we move into a more volatile and dynamic energy era, our models must evolve accordingly—not to replace the Merit Order, but to build upon and modernize it.
References
DA prices:
Energy Charts URL: https://www.energy-charts.info/?l=en&c=DE
Battery predictions:
Aurora Energy Research (2025): https://auroraer.com/insight/the-battery-buildout-in-europe/#:~:text=The%20Battery%20Buildout%20in%20Europe&text=Capacity%20grew%20from%204.8%20GW,driven%20by%20robust%20project%20economics.
Goldman Sachs (2024): https://www.goldmansachs.com/insights/articles/european-energy-storage-a-new-multi-billion-dollar-asset-class
Demand Flexibility:
EURELECTIC (2024) https://www.eurelectric.org/publications/eurelectric-letter-unlocking-the-power-of-flexibility/