1. Introduction
Aggregated supply and demand curves provide a direct visualization of how electricity prices are determined in auction-based power markets. These curves effectively represent the Merit Order in practice, illustrating how supply and demand interact to establish the market price. By analyzing aggregated curves, we can better understand the current market.
2. General Concept
General Creation Aggregated curves are constructed by compiling all linear/single orders submitted by market participants into a single aggregated SELL and BUY curve. The example below illustrates the creation of a SELL curve in a simplified manner. It’s important to note that a unique set of aggregated curves is generated for each delivery period.
Minimum & Maximum Prices In the Day-Ahead auction, orders can only be submitted within a specific price range, currently set between -500 €/MWh and 4,000 €/MWh. These boundaries define the limits of the aggregated curves. If extreme price fluctuations persist in consecutive trading sessions, these limits may be automatically adjusted to maintain market stability.
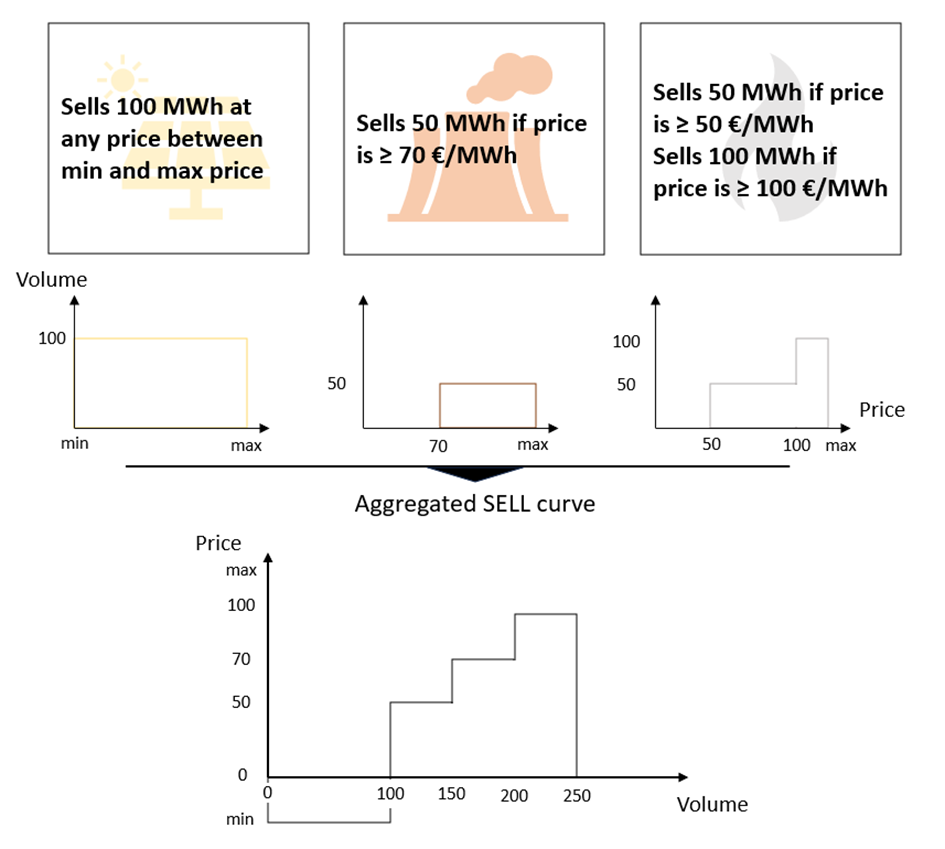
Graph: Example of an aggregation of several individual order to one aggregated curve
3. Composition of real Aggregated Curves
The following graph presents a generic example of an aggregated supply and demand curve, highlighting the components that determine the Market Clearing Price (MCP) and the Market Clearing Volume (MCV).
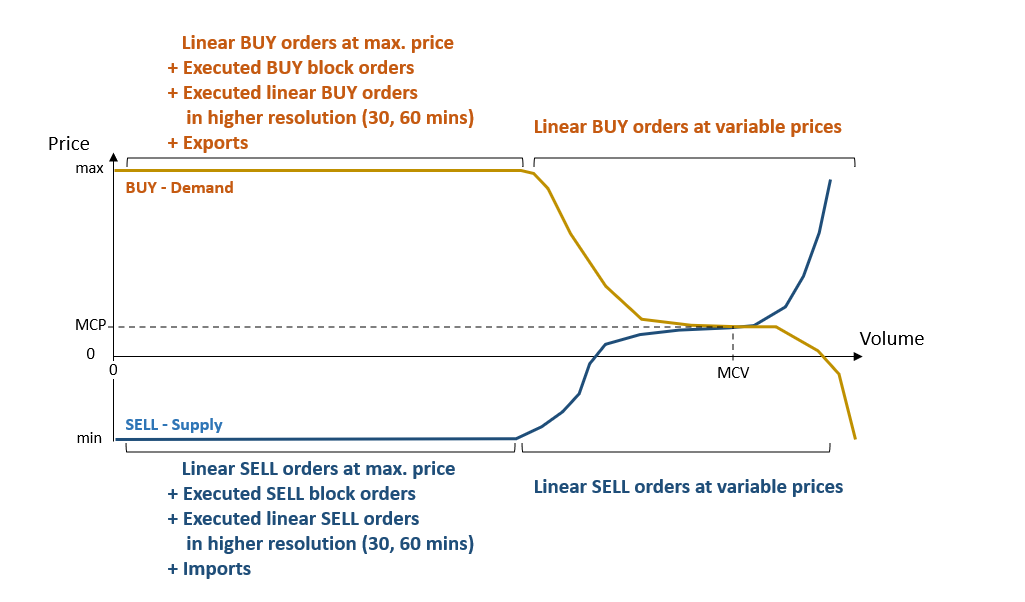
Graph: Generic pair of aggregated curves at market time unit (15 mins as of 30/09/25) published as market results
Linear Orders at Max. or Min. Price Whenever market participants need to buy or sell a certain volume regardless of the price, they will submit this volume for all price levels within the acceptable range (see example A in the first graphic).
Executed Block Orders Block orders are subject to the optimization algorithm, which determines their execution based on the market clearing price across multiple time periods. Once executed, their volumes are added to the aggregated supply at the minimum price for SELL orders and at the maximum price for BUY orders.
Executed linear orders in higher resolution (30, 60 mins) The algorithm runs at a time resolution of 15 mins periods, meaning that a price is calculated for each 15 mins period of the delivery day. However orders can also be submitted in 30 or 60 mins resolution, which is higher that the market time unit of 15 mins. Those orders will be executed if they are in the money during the 15 mins periods they cover. Similar to block orders those executed 30 and 60 mins orders will be added at the min and max price level.
Im-/Exports he market coupling algorithm also determines cross-border electricity trades between different market areas. The net position of a market area (sum of all imports and exports) influences the supply curve:
A positive net position increases the SELL volume, shifting the supply curve to the right.
A negative net position increases the BUY volume, shifting the demand curve to the right.
Linear Orders at Variable Price The rightmost section of the curves consists of price-elastic linear orders, where the volume traded is sensitive to price changes.
Real Aggregated Curves Aggregated curves available on NEMO websites offer valuable insights into current market conditions and the state of the power system. However, there are some limitations, since the exact composition of the published curves is not fully disclosed.
While it is known that the price-elastic segment consists of linear orders, the share of executed block orders versus linear orders at fixed prices remains uncertain. Imports and exports are published separately, allowing analysts to estimate the raw market conditions excluding cross-border influences.
4. Conclusion
Aggregated curves provide a clear and structured representation of supply and demand in electricity markets, offering critical insights into price formation, liquidity conditions, and cross-border trading effects. By studying these curves, market participants can better understand price trends and anticipate market movements.